Mining the Cloud
Imagine the world's information at your fingertips. Imagine being able to slice and dice it as you choose. Imagine you're a sales exec who, with just a few clicks, can pull up reports on consumer spending and demographics, mapped to your sales areas -- or your competitors' sales areas -- just about anywhere.
And the best part is that you don't have to invest in your own data warehouse, with all the accompanying costs and hassles. You can just pull the data out of the cloud.
This will soon be a reality as Microsoft's Windows Azure platform goes commercial, and vast repositories of public and private data are made available via subscription through Microsoft's Dallas project. These data feeds will consist of everything from AP news headlines to business analysis services to topographic maps to global U.N. statistics on just about anything you can think of.
I've been fascinated with Dallas since it was announced at the recent PDC 09 with much fanfare. I keep thinking of all that information out there and what people will be able to do with it. Maybe the yottabytes of government statistics we've been paying for will actually be put to good use.
If you haven't checked out Dallas, you should. It's still free through the end of the month.
Just to show how easy it is, I signed up, subscribed to some feeds and displayed them in a Windows Forms app. I then went further and fed U.S. crime data into a live ASP.NET site that lets me massage and cull information not readily apparent, such as cities with the highest crime rate in each state. (By the way, I'm using MaximumASP's service to host the site; it offers free beta accounts for developers to play around with ASP.NET 4 and Visual Studio 2010.)
I even analyzed the data with Power Pivot and Excel. BI for the masses is here.
Here's how to get started. First, check out the Dallas Quick Start. From there go to the Dallas Developer Portal to sign in with a Live ID, create an account and request an invitation token.
After you get the token you log in and you're in business. At the home page, you will see tabs for the catalog of available subscriptions, your subscriptions, your account keys and an access report that shows you how many times your subscriptions have been tapped.
Clicking on Catalog brings up dozens of feeds to which you can subscribe. Most of them are still in the "coming soon" stage, but available feeds include infoUSA business stats, U.S crime statistics, AP headlines, NASA Mars images and U.N. data. Here's a sampling of some coming feeds:
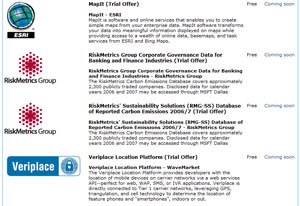 |
|
[Click image to view larger version.] |
I subscribed to "2006 and 2007 Crime in the United States" from DATA.gov. Clicking on that link from your subscription page brings you to a page where you can preview the data and invoke the service, selecting state, city and year, with your choice of a table display or Atom 1.0 and Raw XML formats. Here is how the crime statistics look for Alabama cities for the year 2007, with the preview function:
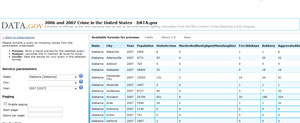 |
|
[Click image to view larger version.] |
Of special interest to developers are the capability to copy the URL for the service to your clipboard, the request header used to call the service, and downloadable C# "service classes" that you can plug into your Visual Studio projects. You can use the request header to invoke the service with REST APIs in just about any programming environment. For .NET developers, all you need to do is plug your account number and a unique user ID (GUID) into the downloaded proxy class code and it will take care of all the nuts and bolts of accessing the service.
I built an ASP.NET Web page and used the crime stats proxy class to display the feed data in a GridView. It looks much like the preview of the data on the portal, with options provided through ListBoxes to display data by state, city and year:
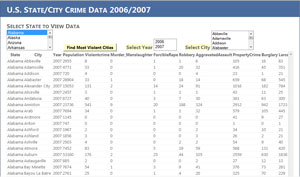 |
|
[Click image to view larger version.] |
To demonstrate rudimentary data analysis, I added a "Find Most Violent Cities" button to display the cities in a particular state that had the highest crime rate (using a standard formula) and highest number of violent crimes in 2006 or 2007. Here's the result:
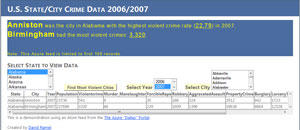 |
|
[Click image to view larger version.] |
As mentioned, I published the project so you can check it out yourself to get an idea of what can be done with minimal effort.
For more serious data analysis and business intelligence, you might want to use Microsoft's Power Pivot. To test it, I downloaded the Office 2010 beta and PowerPivot for Excel 2010 (it's also available for SharePoint 2010).
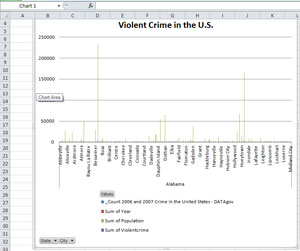
I'm not a numbers guy, so I was lost from there on, but by clicking on the "Analyze" button on my Dallas crime statistics page, I downloaded the feed's data directly into PowerPivot/Excel:
 |
|
[Click image to view larger version.] |
I only managed to put some data into a useless, cheesy looking chart, but you get the idea of what could be done.
From here on, the possibilities are endless, especially when all the promised feeds come online. I wish my free trial subscriptions could go on forever, but Microsoft will soon start commercializing Dallas and the other Azure offerings. I haven't found any subscription pricing info.
In the meantime, I would love to see other ways that developers are using Dallas. As Microsoft's Dave Campbell said at PDC 09, Dallas could be the "killer app" for the cloud. There must be some cool experimentation going on out there.
Please share your project via the comments section here or shoot me an e-mail.
Posted by David Ramel on 01/06/2010